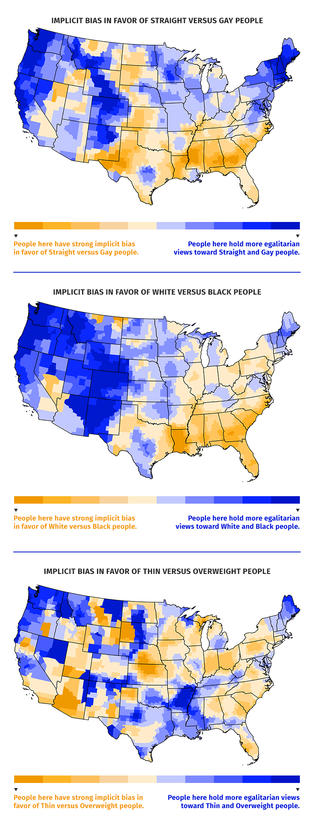
A series of maps created by a UCR professor highlights hot spots for intergroup bias across the nation. The researchers aggregated data to determine the regions where implicit and explicit bias are greatest related to race, weight, and sexual preference. Maps by Jimmy Calanchini & Denise Wolf The maps range from deep blue, which represents places in America with the most egalitarian views, to deep orange, which represents places with the most biased views. For instance, the Northwest is deep blue – egalitarian – on race and sexual preference. Conversely, deep orange stretches across Southern states, representing biases in […]
Click here to visit source. news.ucr.edu
See also Biden nominates Ketanji Brown Jackson to the United States Supreme Court
Powered by Inline Related Posts